The United States has seen much progress in electric school bus adoption over the past few months: Over 1,800 electric school buses have been committed by 354 school districts or fleet operators in 36 states. That’s over 600 more buses than observed six months ago, representing a more than 50% growth in commitments.

While this is noteworthy progress, it’s not nearly enough. There are nearly half a million school buses in the United States that transport more than 20 million children. Some 95% of these school buses run on diesel, a known carcinogen, with air pollution inside buses up to 12 times higher than ambient levels. Daily exposure for children, who are especially susceptible, contributes to asthma and respiratory diseases. It can also cause cognitive impairment, which negatively affects test scores and attendance.
Students from low-income communities are particularly exposed: 60% of students from low-income families ride the bus to school, compared to 45% of students from families with higher incomes. Children of color are more likely to suffer from asthma, due in part historically racist lending, transit, housing and zoning policies that concentrated Black and Brown communities closer to highways and other sources of vehicle-based air pollution. In addition, children with disabilities often ride longer on buses.
Electrifying the entire fleet of school buses can help address these health concerns and inequalities. In addition, school bus electrification could reduce greenhouse gas emissions from all buses in the country by 35% per year, offer resiliency support to the electric grid and support jobs in a growing industry. But how is electric school bus adoption progressing, and what needs to happen next? Here are some critical findings on electric school bus adoption and the trends they highlight.
The United States Has Over 1,800 Committed Electric School Buses
As of December 2021, a total of 1,828 “committed” electric school buses were identified across the U.S. This includes 664 new committed ESBs, a 57% increase since June 2021. These commitments come from 354 school districts or private fleet operators that have committed to procuring ESBs, an increase of 112. Nearly 100 new ESBs, or about 15% of all new buses, were committed with funding from the Volkswagen (VW) Environmental Mitigation Trust. However, these numbers will likely level off as the Volkswagen funds are depleted.
But what exactly is a “committed” electric school bus?
A committed ESB is not the same as an ESB currently on the road. An ESB is considered committed when a school district or fleet operator has been awarded funding to purchase it, or has made a formal agreement for a purchase with a manufacturer or dealer. Committed ESBs also include those that have been delivered to the school district or fleet operator and those that are in operation. Future updates will include data on the current status of committed ESBs (i.e. awarded, ordered, delivered or in operation), offering a more detailed understanding of how many buses are on the road today.
ESBs Are Now Committed in 36 States, and California Still Leads
There are 36 states with committed ESBs, including three new states since June 2021: Hawaii, Nevada and Rhode Island. While the majority of U.S. states now have committed ESBs, most of these buses and districts are concentrated on the coasts, similar to the trend observed in summer 2021. Distribution among regions of the country also remain similar.
California remains the clear leader in ESB adoption. With 792 committed ESBs, the state has slightly less than half of all committed ESBs in the United States, and more than the next four states combined (Maryland, Florida, New York and Virginia). California has also seen the largest increase in the number of committed ESBs and number of school districts with committed ESBs, due in part to robust incentive programs.
However, several other states have seen large jumps in committed ESBs since the summer. Florida has 151 new committed ESBs, and New York, Virginia, New Jersey and Colorado all experienced double-digit increases. The top 10 states with the most committed ESBs remained largely the same, with Oregon moving onto the list. The numbers of committed ESBs drops off sharply after the top three states. The other 26 states with committed ESBs each have 11 or fewer, totaling 101.
The Number of School Districts with Committed ESBs Doubled Since June
In the past six months, the number of school districts that have one or more committed ESBs has grown by 46% to reach 354. However, a large majority of these school districts have just a few committed ESBs. The top 10 school districts with the most committed ESBs represent 40% of all committed ESBs in the country with a combined 724 buses.
The number of school districts with a relatively large number of committed ESBs (10 or more) has also doubled, from 14 to 28. These 28 districts are in just five states: California, Florida, Maryland, New York and Virginia. This suggests that an enabling environment at the state level can play a strong role in supporting ESB commitments at the school district level.
Most ESBs Are Still in Suburban School Districts
The majority of ESBs are still located in suburban school districts, although the percentage of total committed ESBs in suburban districts decreased from 64% to 57% since June 2021. The distribution of ESBs among locales roughly follows the percent of students in those locales. However, there is a slightly higher number of ESBs per suburban student, and a slightly lower number of ESBs per rural student.
A larger share of urban school districts than rural school districts have started their ESB transition. A quarter of rural school districts with committed ESBs are in California and funded by the California Air Resources Board (CARB) Rural School Bus Pilot Project.
Is Electric School Bus Adoption Happening Equitably Across Low- and High-Income School Districts?
The distribution of committed ESBs among school districts with differing socio-economic characteristics reflects a complex story. To unpack that story, this section presents data on the relationship between electric school bus adoption and three variables describing socio-economic characteristics: school district median household incomes, school district poverty rate and the CDC’s Social Vulnerability Index.
WRI’s newly published dataset includes two of these socio-economic variables: school districts’ income and poverty levels. To understand the trends in this data, it’s critical to understand that a district’s median household income level and its poverty rate are not necessarily correlated. For example, school districts can have a high percentage of households in poverty, but also a fairly high median household income if many other households have moderate or high incomes.
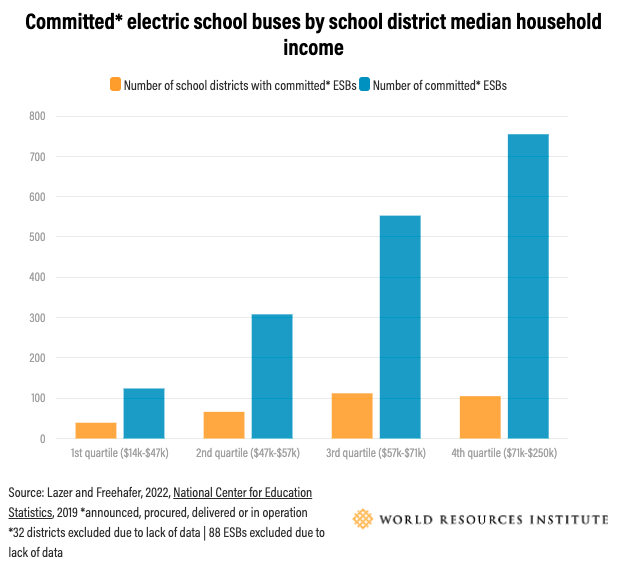
As shown in the following graph, which groups school districts into quartiles based on their median household income, there is a strong correlation between high median household income and a high number of committed ESBs. There is also a clear correlation between high median household income and the number of school districts with committed ESBs. Looking at this data alone, it would seem that ESBs are disproportionately in high-income school districts.

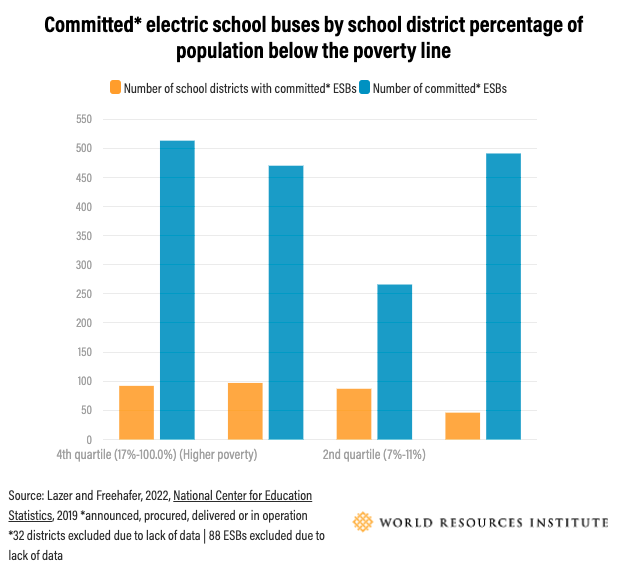
However, the story is more complex. Despite this data on median household income, ESBs are not concentrated in school districts with less poverty. The following graph groups school districts into quartiles based on the percentage of households below the federal poverty line. Both committed ESBs and school districts with committed ESBs are distributed more evenly among school districts of varying poverty levels. There are roughly 500 committed ESBs in both the quartile with the lowest percent of poverty and the quartile with the highest percent of poverty. Similarly, looking at school districts with committed ESBs, the top three quartiles all have approximately 100 school districts with ESB commitments, and the quartile with the lowest percent poverty has half as many at 46. This trend persists even when excluding California and Montgomery County, Maryland, which have so many committed ESBs that they might skew the findings.

The CDC’s Social Vulnerability Index offers yet another angle on the question of equity and electric school bus adoption. According to the Index, which measures vulnerability to natural disasters based on factors such as poverty and transportation access, the largest share of committed ESBs — roughly one third — were in the country’s top 25% most vulnerable counties. However, the breakdown changed dramatically once Californian school districts were excluded, with just a small fraction of school districts with electric buses located in the most vulnerable areas. Based on that, it could seem that — outside of California — the transition to ESBs was not happening equitably.
In summary, committed ESBs seem to correlate with high-income households, but not with low poverty rates. It’s still unclear how different factors are driving these trends, and future data will help paint a more nuanced picture of the equity-related trends in ESB adoption and explore potential causes. Future updates will include analysis of the distribution of ESBs among school districts with different percentages of people of color, levels of air pollution and percentages of the population below 200% of the federal poverty level, which would capture households that are struggling economically in places with high living costs.
What’s Next To Scale Up Electric School Bus Adoption?
ESB adoption is growing, but there is still a long way to go. While there has been a significant increase in committed ESBs since June 2021, they are still less than 1% of the U.S. school bus fleet. But momentum continues to build. In November 2021, Congress enacted the Infrastructure Investment and Jobs Act, which includes $5 billion over five years for electric and lower-emission school buses. The Environmental Protection Agency (EPA) will distribute this funding through the Clean School Bus Program, which will allocate $500 million per year exclusively for ESBs and may prioritize high-need, tribal, rural or low-income schools. WRI is working to ensure that funding is distributed equitably to communities that will benefit the most from school bus electrification.

Originally Published by World Resources Institute – August 5, 2021 By Leah Lazer and Lydia Freehafer.